
The Stats That Actually Win Games:
Coding & Medical Documentation
Wed, Aug 12, 2026 · 1:00–1:45 PM CT · Virtual
Film Room
Game Recap
Q2 opened in Death Valley. Griffin Hebert put his own stat line on the screen — Sept 17, 2022, Louisiana Tech at #5 Clemson, 80,542 in the stands, the Bulldogs a 32.5-point underdog: 122 receiving yards on 5 catches, including a 46-yard grab on 3rd and 9. A box score any tight end would take. Louisiana Tech still lost. Two of those drives ended in nothing, one settled for a field goal, and the fourth stalled at the 20. The scoreboard didn't care about the yardage. 122 yards ≠ a win — and claims submitted ≠ cash collected.
Asbel Montes carried that frame into four positions on one scoreboard: coding, documentation, level of service, and metrics. On coding — default codes aren't final answers, coding exposes what documentation hides, and certification is a benchmark rather than a mandate. On documentation — one story, three documents, zero conflicts, with interfacility transfers as the highest-risk category and a reminder that “on file” is not the same as verified. On level of service — nearest appropriate facility shifts by state, under-billing costs as much as over-billing, and patient choice is a reason, not a default. On metrics — three tiers (executive, management, operations) reading one data set, benchmarked at 5–7 days to bill and 45–60 days DSO, with every write-off classified as caused, chosen, or contracted.
Then Sonia Coleman showed what it looks like when a team actually runs the play. EMSA — Oklahoma's largest pre-hospital provider, serving 1.1 million people across Tulsa, Oklahoma City and six smaller communities on 246,029 responses and 186,194 transports in 2025 — stabilized pre-billing and cleared its aging backlog, then turned to the mid-revenue cycle in January 2024 and let the denial data pick the target. Her team rebuilt charge capture around collaboration with operations and clinical training, put documentation training inside the FTEP process, added a CAD-to-ePCR-to-billing reconciliation report, tightened medical necessity using ePCR, PCS and HIE data, and hired certified coders backed by monthly audits with real feedback loops. The results, as of mid-2026: CO-16 denials down 50%, coding quality at 97%, clean claim submission support at 99%, A/R over 90 days from 31% to 13%, and A/R over 180 days from 14% to 1%.
Key Takeaways
Game Notes
- 01Yards aren't points — measure cash collected and clean conversion, not claims submitted.
- 02Default codes aren't final answers; coding exposes what documentation hides.
- 03One story, three documents, zero conflicts — and “on file” isn't the same as verified.
- 04Interfacility transfers carry the highest documentation risk. Treat them that way.
- 05Under-billing costs you as much as over-billing; patient choice is a reason, not a default.
- 06Nearest appropriate facility shifts by state — know your state's definition.
- 07Three tiers, one data set: executive, management and operations reading the same numbers.
- 08Benchmark to 5–7 days to bill and 45–60 days DSO; classify every write-off as caused, chosen, or contracted.
- 09Let the denial data pick your target — EMSA analysed CO-16 and CO-252 volume before changing anything.
- 10Put documentation training inside onboarding (FTEP), not in a once-a-year refresher.
- 11Reconcile CAD → ePCR → billing so no call quietly disappears before it's a charge.
- 12Monthly coding audits only work with a feedback loop attached.
From the Session
Resources & Handouts
Handout (PDF)
CFO's Guide: Top 6 Best Practices Benchmarks
The one-page benchmark card we pushed out during the session — days to bill, DSO, aging, cash posting, cost per claim and net collection rate.
Open ↗EMSA · Web
EMSA 2025 Annual Report
Shared by Sonia Coleman during her segment — EMSA's full-year report behind the 2025 snapshot numbers.
Open ↗EMSA · PDF
EMSA June 2026 Revenue Cycle Performance KPI Dashboard
Shared by Sonia Coleman during her segment — the monthly KPI dashboard behind the denial and aging results.
Open ↗The Huddle
Who was on the field


Asbel Montes
Co-Founder & Managing Partner
Solutions Group
Host of The Revenue Cycle Playbook and The Leadership Lab podcast.

Griffin Hebert
Business Development Manager
Solutions Group
Former Seattle Seahawks and Philadelphia Eagles tight end.
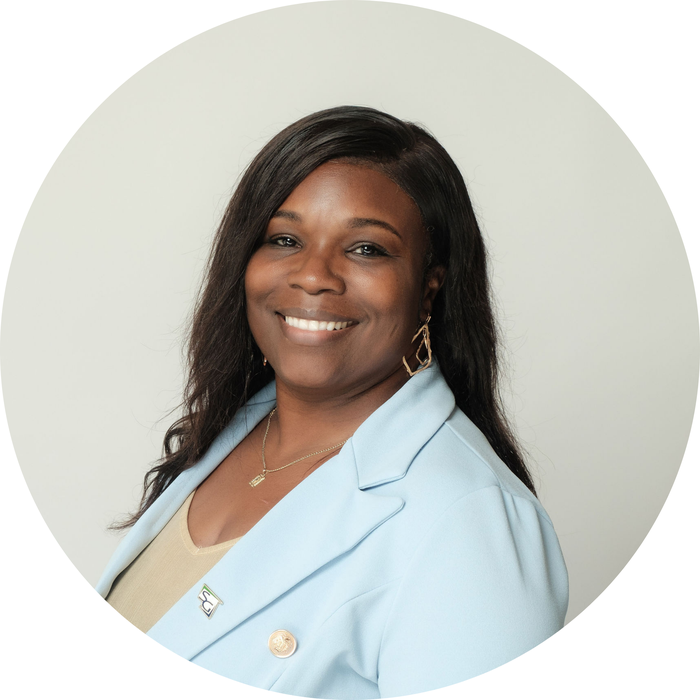
Fredricka Harris
Program Manager
Solutions Group
New articles, session recaps and the occasional benchmark card — straight to your inbox.
Subscribe